Local knowledge and local expertise inspired us to design a model contextualized to where we work. With decades of experience working in the region and sector, our team of 65 in Uganda is the best in the business.
Northern Uganda is the poorest region in the country and is impacted by many challenges: unpredictable growing seasons due to climate change, unpredictable markets due to global instability, and a refugee crisis along the northern border.
We work in some of the most remote parts of this region not because it’s easy, but because it’s where we can have the most impact. The people of Northern Uganda and South Sudan consistently inspire us with their creativity and grit.
Asset based development delivers results because it’s built on the resources available in a given context. In our context, clients have access to an abundance of land and labor, which is why we partner with them to grow their farming capacity as step one on their journey out of extreme poverty.
Select a location
Hover to interact with map
Our Impact
Raises the Bar
Place Holder text for Subtitle
Scroll Down
Northern Uganda
2.8780° N, 32.7181° E
Transformational Results.
Durable Impact.
Despite being our largest cohort to date, Cohort 2024-2025 increased their income faster than any previous cohort. They’re currently at the halfway point of the program and here’s how they’re doing:
Transformational Results.
Durable Impact.
Despite being our largest cohort to date, Cohort 2024-2025 increased their income faster than any previous cohort. They’re currently at the halfway point of the program and here’s how they’re doing:
Transformational Results.
Durable Impact.
Despite being our largest cohort to date, Cohort 2024-2025 increased their income faster than any previous cohort. They’re currently at the halfway point of the program and here’s how they’re doing:
Cohort 2024-2025
(average)
Extreme Poverty Line ($2.15)
Wellness
Agency
Connection
Prosperity
This graph shows daily income per household member, converted from Ugandan Shillings to USD PPP (purchasing power parity).
We are commited to radical transparency and continued improvement. We invite you to take a deep dive into our previous outcomes, and most importantly the durability of those outcomes, by selecting different cohorts at the top of the graph.
MULTIDIMENSIONAL
IMPACT.
Every part of our program has been systematically designed to give our clients the opportunity to create their best possible future.
Cohort 2024-2025 is halfway through their time in the program, here’s how they’re doing since they started:
Cash Savings
330%
Increase
Prosperity
Clients improve savings habits so that they can weather shocks and remain out of poverty in perpetuity.
Net Worth
250%
Increase
Prosperity
Investing in productive long term assets is vitally important as it helps ensure that clients remain prosperous over the long term.
Agency
66%
Improvement
Agency
Locus of Control (Agency) provides a glimpse into how and when mindset change is taking place in the lives of our clients. As they transition from “I can’t” to “I’m capable” their locus of control shifts from external to internal.
Physical Health
25%
Improvement
Wellness
Being physical healthy is vital to a full life - improvements in health and sanitation practices have a profound impact in the lives of our clients and their families.
SHALOM
(Spiritual Health and Life Orientation Measure)
24%
Improvement
Connection
SHALOM is a measurement tool used to assess relational and spiritual well-being. Improvement is based on each individual as it compares a person's lived experiences with their ideals across four domains: personal, communal, environmental, and transcendental.
UNDERSERVED AND
HARDEST TO REACH.
We seek out those who can benefit most from our program. This means spending long days in the field, traveling to communities that take hours to reach, and are often completely disconnected from the marketplace.
To gain visibility into who we are impacting the most, we track results across four groups (quartiles) that are divided equally based on income levels at baseline. We integrate this data into our operations so that personnel resources can be deployed where they are needed most.
Cohort 2024
Cohort 2022
Cohort 2020
Cohort 2018
Baseline 2023
Midline 2024
% change from Baseline
Highest Earners
$0.94
$3.94
319%
Second Highest Earners
$0.64
$3.53
452%
Second Lowest Earners
$0.40
$3.48
770%
Lowest Earners
$0.17
$3.55
1988%
Baseline 2021
Midline 2022
Endline 2023
2024 Post Program
% change from Baseline
Highest Earners
$1.63
$3.55
$4.73
$4.83
196%
Second Highest Earners
$0.83
$2.82
$4.37
$4.59
453%
Second Lowest Earners
$0.50
$2.92
$4.41
$5.41
982%
Lowest Earners
$0.22
$2.60
$4.31
$4.24
1827%
Baseline 2019
Midline 2020
Endline 2021
2024 Post Program
% change from Baseline
Highest Earners
$1.28
$3.55
$4.75
$7.09
454%
Second Highest Earners
$0.51
$2.37
$2.91
$5.80
1037%
Second Lowest Earners
$0.27
$2.15
$2.90
$4.75
1659%
Lowest Earners
$0.07
$2.06
$2.64
$5.28
7443%
Baseline 2017
Midline 2018
Endline 2019
2024 Post Program
% change from Baseline
Highest Earners
$0.62
$2.96
$4.26
$4.51
627%
Second Highest Earners
$0.16
$2.04
$3.72
$2.69
1581%
Second Lowest Earners
$0.06
$1.67
$2.45
$5.78
9533%
Lowest Earners
$0.01
$1.44
$2.15
$4.63
46200%
This graph shows daily income per household member, converted from Ugandan Shillings to USD PPP (purchasing power parity).
We are commited to radical transparency and continued improvement. We invite you to take a deep dive into our previous outcomes, and most importantly the durability of those outcomes, by selecting different cohorts at the top of the graph.
ABOVE THE EXTREME
POVERTY LINE.
Averages are great for articulating high level impact - and, of course, we remove the top and bottom 5% of all of our data sets to better reflect our true impact - but we have a precise goal, so we track our impact accordingly. On this graph you’ll see how we’ve been doing.
Progress out of Extreme Poverty
Cohort 2024
Cohort 2022
Cohort 2020
Cohort 2018
This graph shows daily income per household member, converted from Ugandan Shillings to USD PPP (purchasing power parity).
Despite rapidly increasing the size of our program every two-years, we have improved our primary outcome goal with each new two-year cohort. In this graph you can take a look at our progress over time, and most importantly, our client's continued progress out of poverty after graduation.
CLIENTS CHANGE COMMUNITIES.
We invest deeply into a community over two years. Upon program completion, groups transition into formal farming cooperatives and reap the benefits of economies of scale.
This is where the catalytic nature of our intervention takes off: community members that did not participate in our program begin joining cooperatives started by those who did.
This creates new opportunities for communities to access markets, receive support, and change their circumstances.
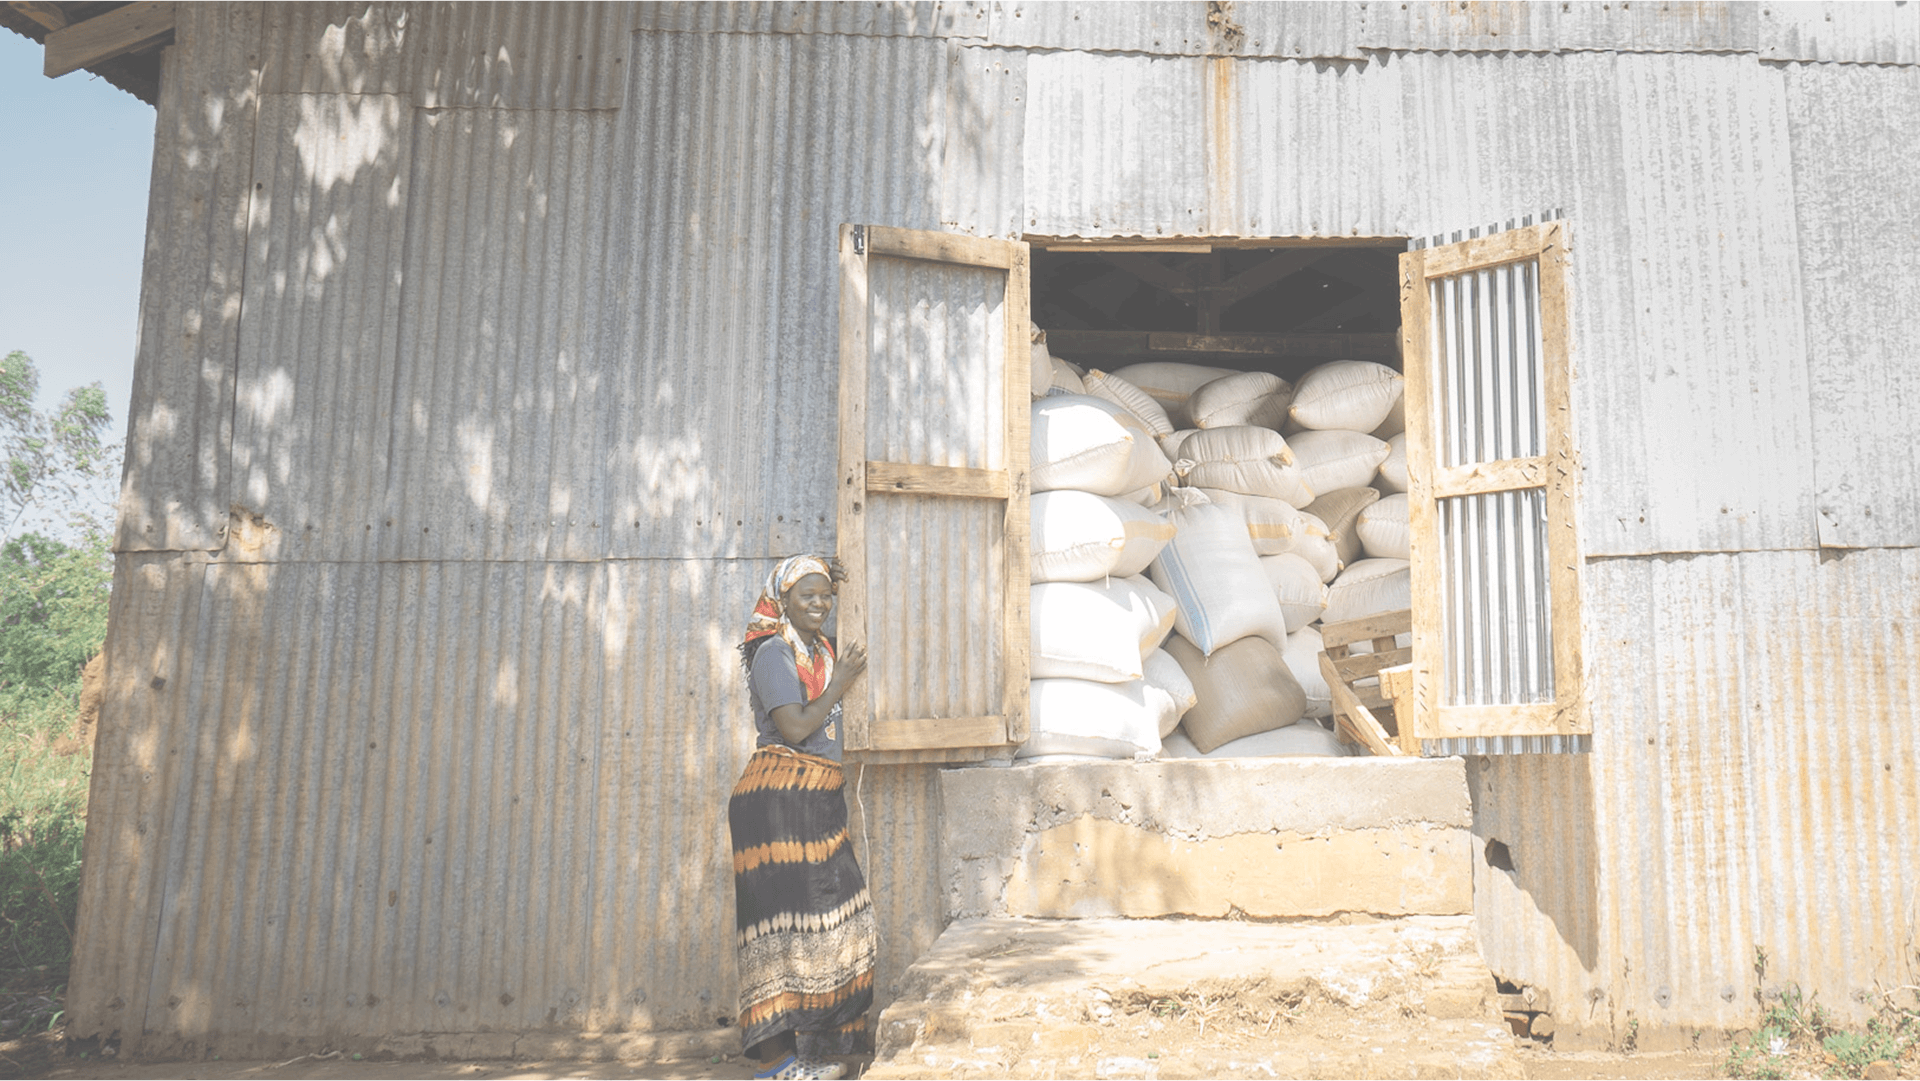
Cooperatives are rapidly expanding and investing to create their best possible future. They’re purchasing tractors, value-addition processing equipment, and building store houses
CATALYTIC IMPACT
CATALYTIC IMPACT
CATALYTIC IMPACT
CATALYTIC IMPACT
Our Approach
Our Approach
Our Approach
Our Approach
the new cooperative members, who have received no direct services from us, are earning above the extreme poverty line and significantly more than their peers.
New Cooperative Members
This graph shows daily income per household member, converted from Ugandan Shillings to USD PPP (purchasing power parity).
This graph shows the impact that our clients are having on their communities as they open up membership to new cooperative members.
THE BOTTOM LINE.
Our clients — and their communities — are making a complete and durable exit from extreme poverty.